system系统启动Prometheus
安装好Prometheus之后的不足是二进制编译安装的Prometheus并没有自带服务,需要我们创建服务
cat <<EOF >/usr/lib/systemd/system/prometheus.service
[Unit]
Description=prometheus
After=network.target

[Service]
Type=simple
User=root
ExecStart=/usr/local/prometheus/prometheus --config.file=/usr/local/prometheus/prometheus.yml --storage.tsdb.path=/data/prometheus --storage.tsdb.retention=15d --log.level=info
Restart=on-failure

[Install]
WantedBy=multi-user.target
EOF
systemctl daemon-reload
systemctl start prometheus
systemctl enable prometheus
ss -anplut|grep 9090
这时候可以看到prometheus服务可以启动
system系统启动node_exporter
cat <<EOF >/usr/lib/systemd/system/node_exporter.service
[Unit]
Description=node_exporter
Documentation=https://prometheus.io/
After=network.target

[Service]
Type=simple
User=root
ExecStart=/usr/local/node_exporter/node_exporter
Restart=on-failure

[Install]
WantedBy=multi-user.target
EOF
systemctl daemon-reload
systemctl start node_exporter
systemctl enable node_exporter
ss -anplut|grep 9100
这时候可以看到node_exporter服务可以启动
微信webhook机器人报警插件(webhook-adapter)
docker run -d --name wechat --restart always -p 8080:80 guyongquan/webhook-adapter --adapter=/app/prometheusalert/wx.js=/wx=https://qyapi.weixin.qq.com/cgi-bin/webhook/send?key=439c18d1-***
#后面接自己机器人接口的key
docker ps|grep wechat
安装配置alertmanager.yml
wget https://github.com/prometheus/alertmanager/releases/download/v0.19.0/alertmanager-0.19.0.linux-amd64.tar.gz
tar -zvxf alertmanager-0.19.0.linux-amd64.tar.gz -C /usr/local/prometheus
mv /usr/local/prometheus/alertmanager-0.19.0.linux-amd64  /usr/local/prometheus/alertmanager
vim /usr/local/prometheus/alertmanager/alertmanager.yml
global:
  resolve_timeout: 5m
route:
  group_by: ['alertname']
  group_wait: 10s
  group_interval: 10s
  repeat_interval: 1h
  receiver: 'web.hook'
receivers:
- name: 'web.hook'
  webhook_configs:
  - send_resolved: true
    url: 'http://192.168.2.59:8080/adapter/wx'
inhibit_rules:
  - source_match:
      severity: 'critical'
    target_match:
      severity: 'warning'
    equal: ['alertname', 'dev', 'instance']
url中的ip地址填写自己的企业微信插件容器地址
system系统启动启动alertmanager
cat <<EOF >/usr/lib/systemd/system/alertmanager.service
[Unit]
Description=alertmanager
After=network.target

[Service]
Type=simple
User=root
ExecStart=/usr/local/prometheus/alertmanager/alertmanager --config.file=/usr/local/prometheus/alertmanager/alertmanager.yml
Restart=on-failure

[Install]
WantedBy=multi-user.target
EOF
systemctl daemon-reload
systemctl start alertmanager
systemctl enable alertmanager
ss -anplut|grep 9093
配置告警规则rules
mkdir -p /usr/local/prometheus/rules/
cd /usr/local/prometheus/rules/
vim /usr/local/prometheus/rules/node_status.yml
groups:
    - name: 主机状态-监控告警
      rules:
      - alert: 主机状态
        expr: up == 0
        for: 1m
        labels:
          status: 很是严重
        annotations:
          summary: ":服务器宕机"
          description: ":服务器延时超过5分钟"
      - alert: CPU使用状况
        expr: 100-(avg(irate(node_cpu_seconds_total{mode="idle"}[5m])) by(instance)* 100) > 60
        for: 1m
        labels:
          status: 通常告警
        annotations:
          summary: " CPU使用率太高!"
          description: " CPU使用大于60%(目前使用:%)"
      - alert: 内存使用
        expr: 100 -(node_memory_MemTotal_bytes -node_memory_MemFree_bytes+node_memory_Buffers_bytes+node_memory_Cached_bytes ) / node_memory_MemTotal_bytes * 100> 80
        for: 1m
        labels:
          status: 严重告警
        annotations:
          summary: " 内存使用率太高!"
          description: " 内存使用大于80%(目前使用:%)"
      - alert: IO性能
        expr: 100-(avg(irate(node_disk_io_time_seconds_total[1m])) by(instance)* 100) < 60
        for: 1m
        labels:
          status: 严重告警
        annotations:
          summary: " 流入磁盘IO使用率太高!"
          description: " 流入磁盘IO大于60%(目前使用:)"
      - alert: 网络
        expr: ((sum(rate (node_network_receive_bytes_total{device!~'tap.*|veth.*|br.*|docker.*|virbr*|lo*'}[5m])) by (instance)) / 100) > 102400
        for: 1m
        labels:
          status: 严重告警
        annotations:
          summary: " 流入网络带宽太高!"
          description: "流入网络带宽持续2分钟高于100M. RX带宽使用率"
      - alert: 网络
        expr: ((sum(rate (node_network_transmit_bytes_total{device!~'tap.*|veth.*|br.*|docker.*|virbr*|lo*'}[5m])) by (instance)) / 100) > 102400
        for: 1m
        labels:
          status: 严重告警
        annotations:
          summary: " 流出网络带宽太高!"
          description: "流出网络带宽持续2分钟高于100M. RX带宽使用率"
      - alert: TCP会话
        expr: node_netstat_Tcp_CurrEstab > 1000
        for: 1m
        labels:
          status: 严重告警
        annotations:
          summary: " TCP_ESTABLISHED太高!"
          description: " TCP_ESTABLISHED大于1000%(目前使用:%)"
      - alert: 磁盘容量
        expr: 100-(node_filesystem_free_bytes{fstype=~"ext4|xfs"}/node_filesystem_size_bytes {fstype=~"ext4|xfs"}*100) > 80
        for: 1m
        labels:
          status: 严重告警
        annotations:
          summary: " 磁盘分区使用率太高!"
          description: " 磁盘分区使用大于80%(目前使用:%)"
配置promethus.yml
vim /usr/local/prometheus/promethus.yml
global:
  scrape_interval:     60s
  evaluation_interval: 20s
  scrape_timeout: 15s
rule_files:
  - '/usr/local/prometheus/rules/node_status.yaml'
scrape_configs:
  - job_name: abcdocker_node
    scrape_interval: 3s
    static_configs:
      - targets: ['192.168.2.59:9100']
        labels:
          instance: master2
alerting:
  alertmanagers:
    - static_configs:
        - targets: ['192.168.2.59:9093']
重启所有服务
systemctl restart node_exporter
systemctl restart prometheus
systemctl restart alertmanager
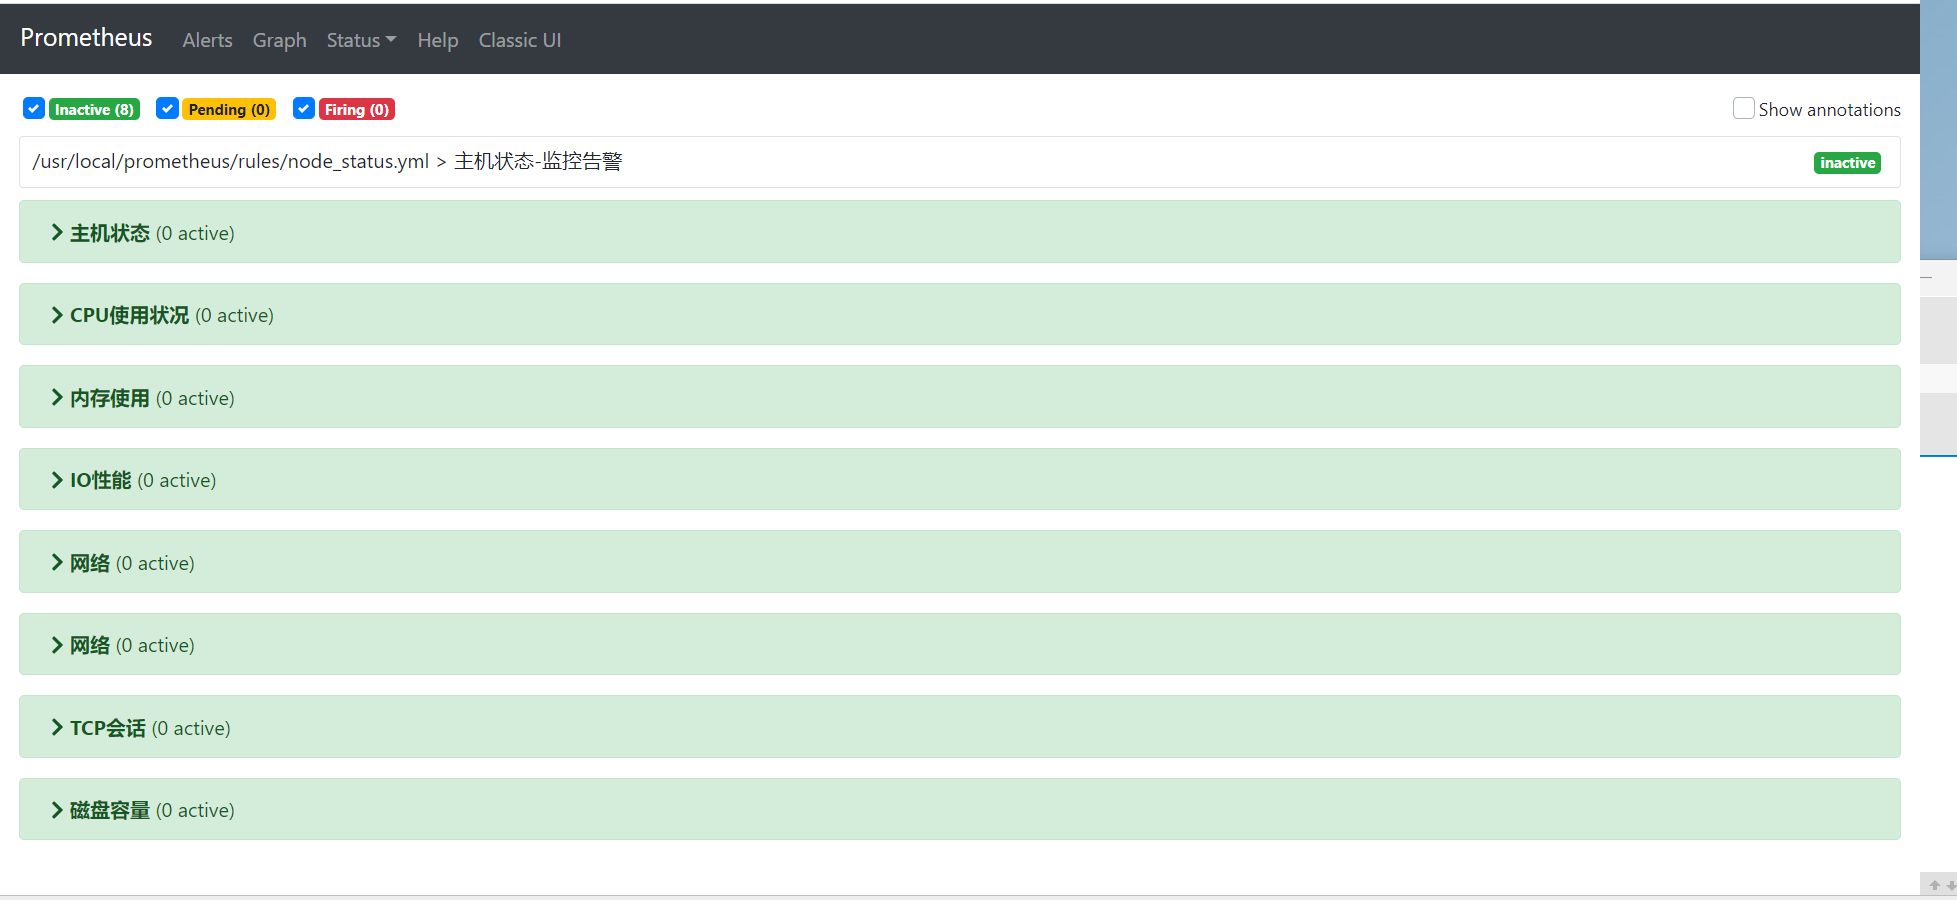
查看告警规则
可以在Prometheus的web前端看到规则已经生效
192.168.2.59:9090
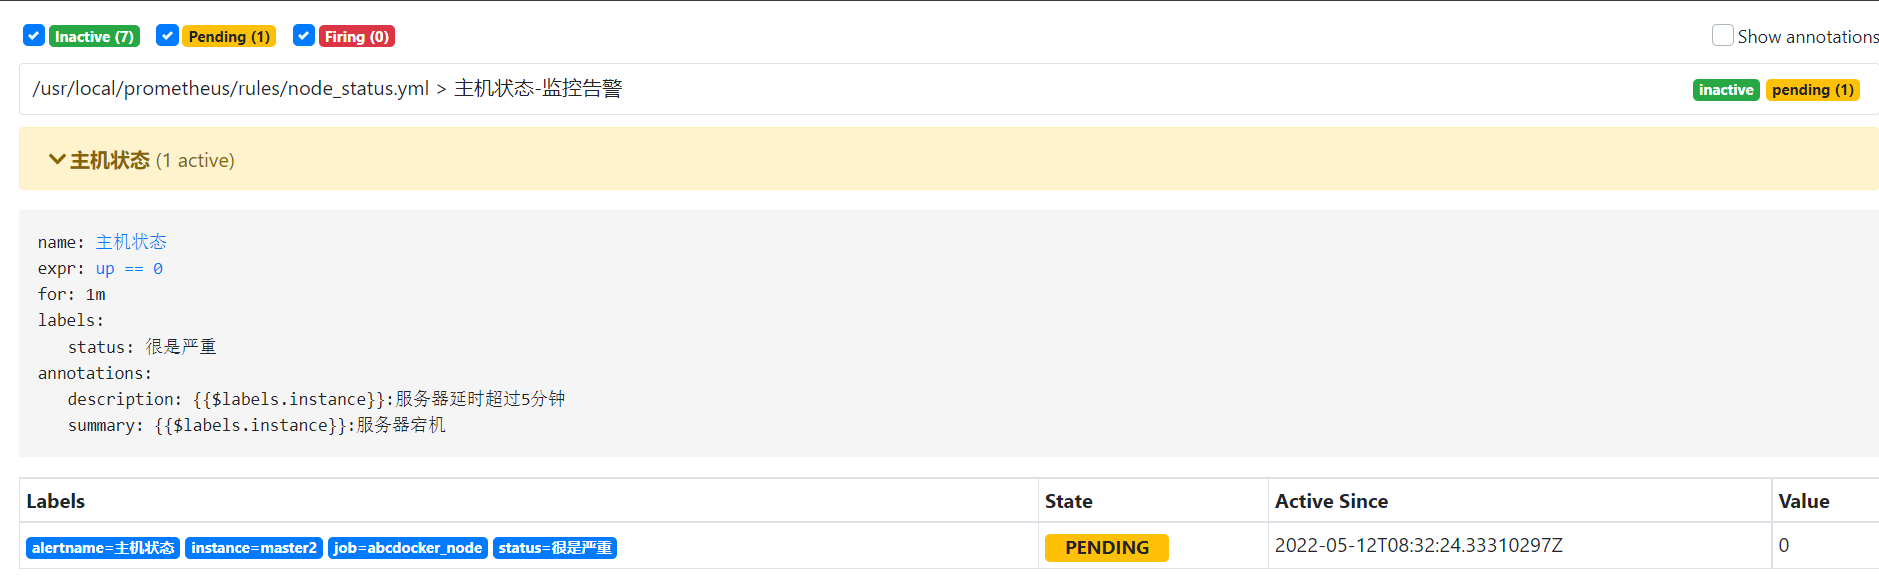
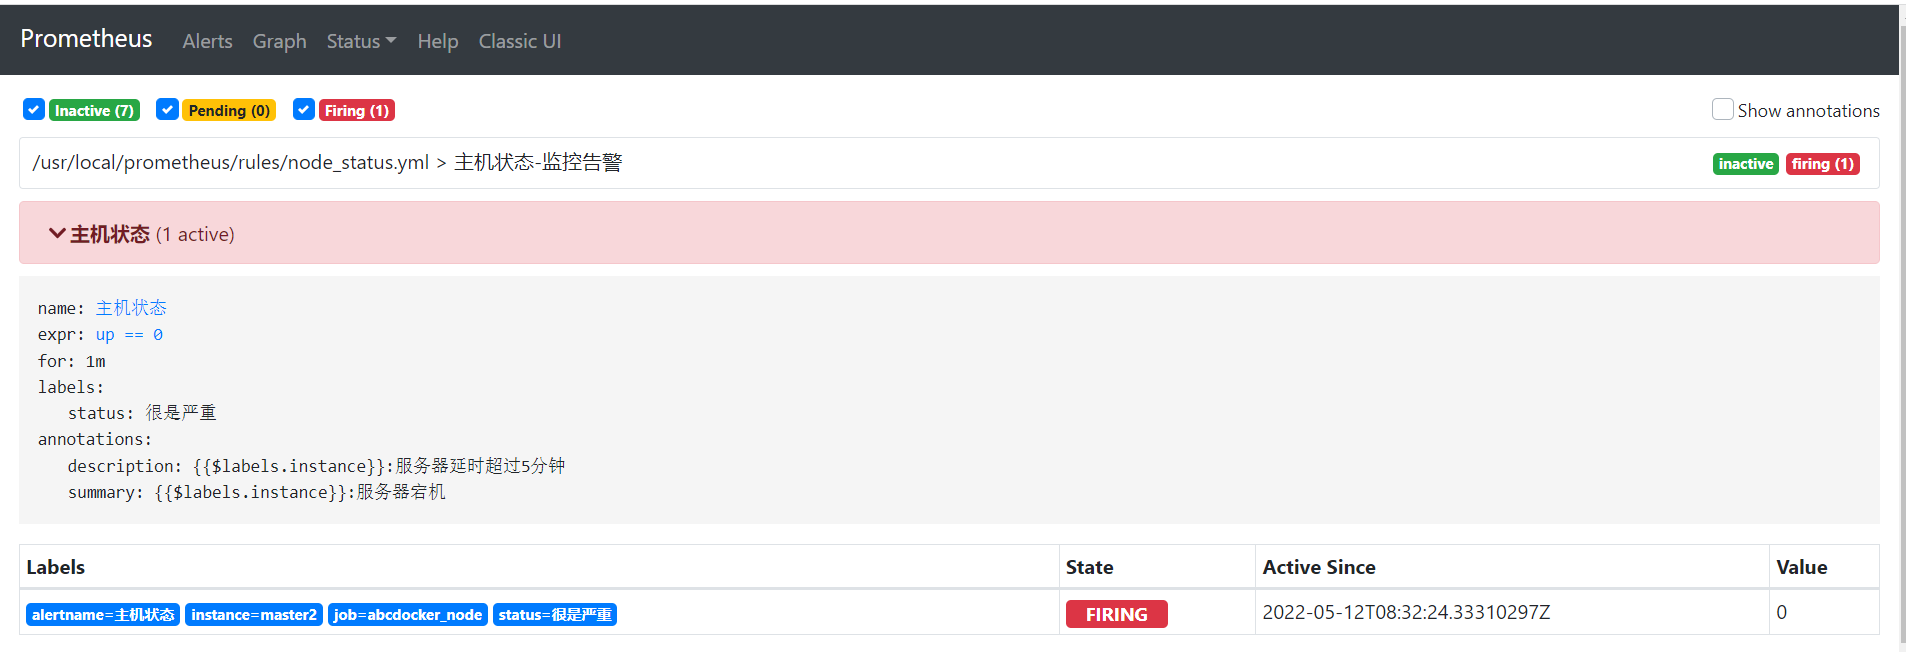
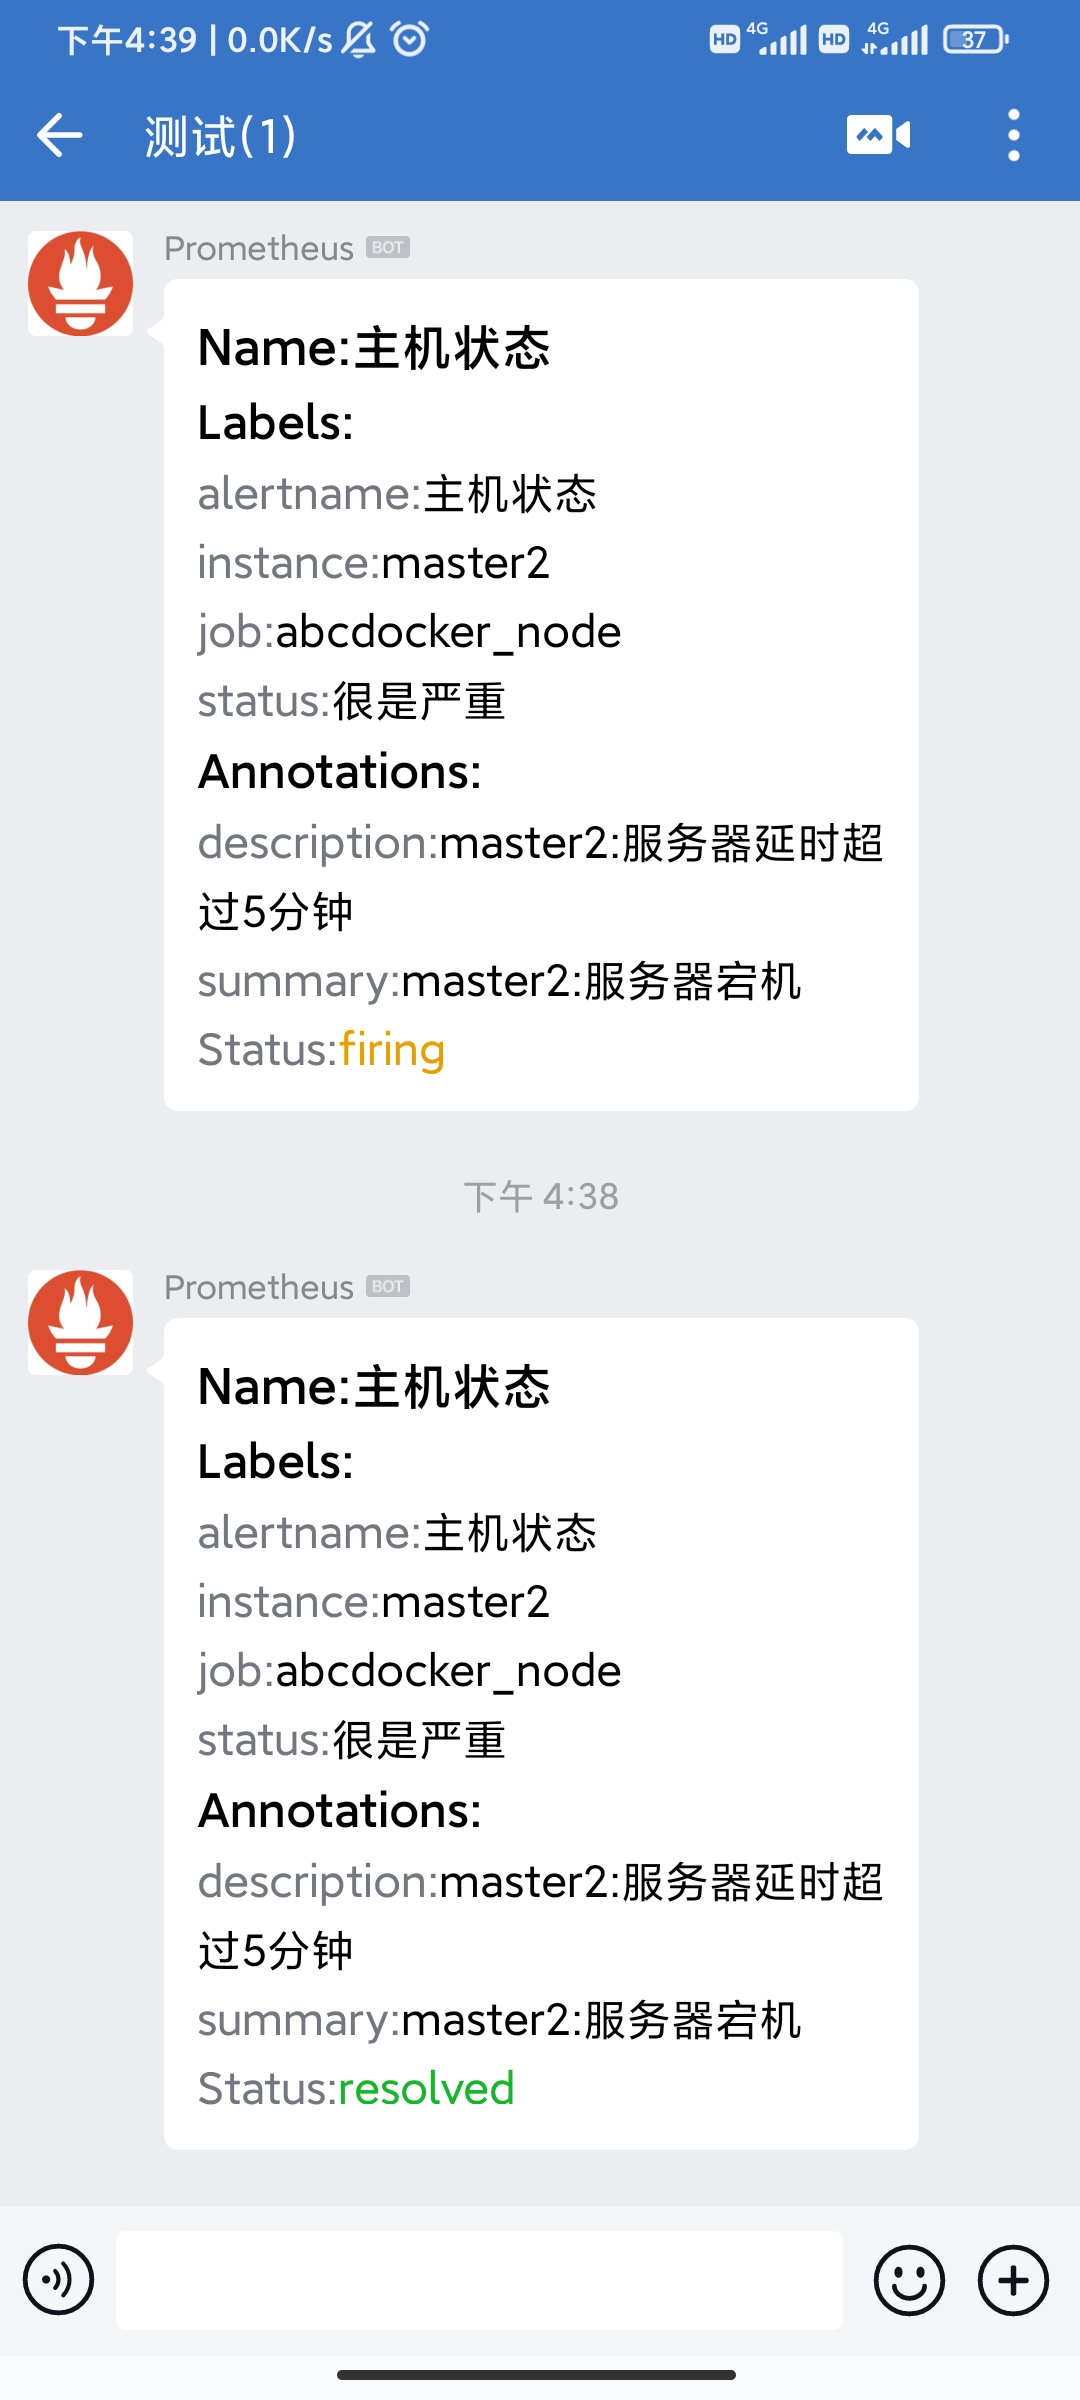
接下来我们停掉node_exporter,看到主机状态变为pending,然后变为firing
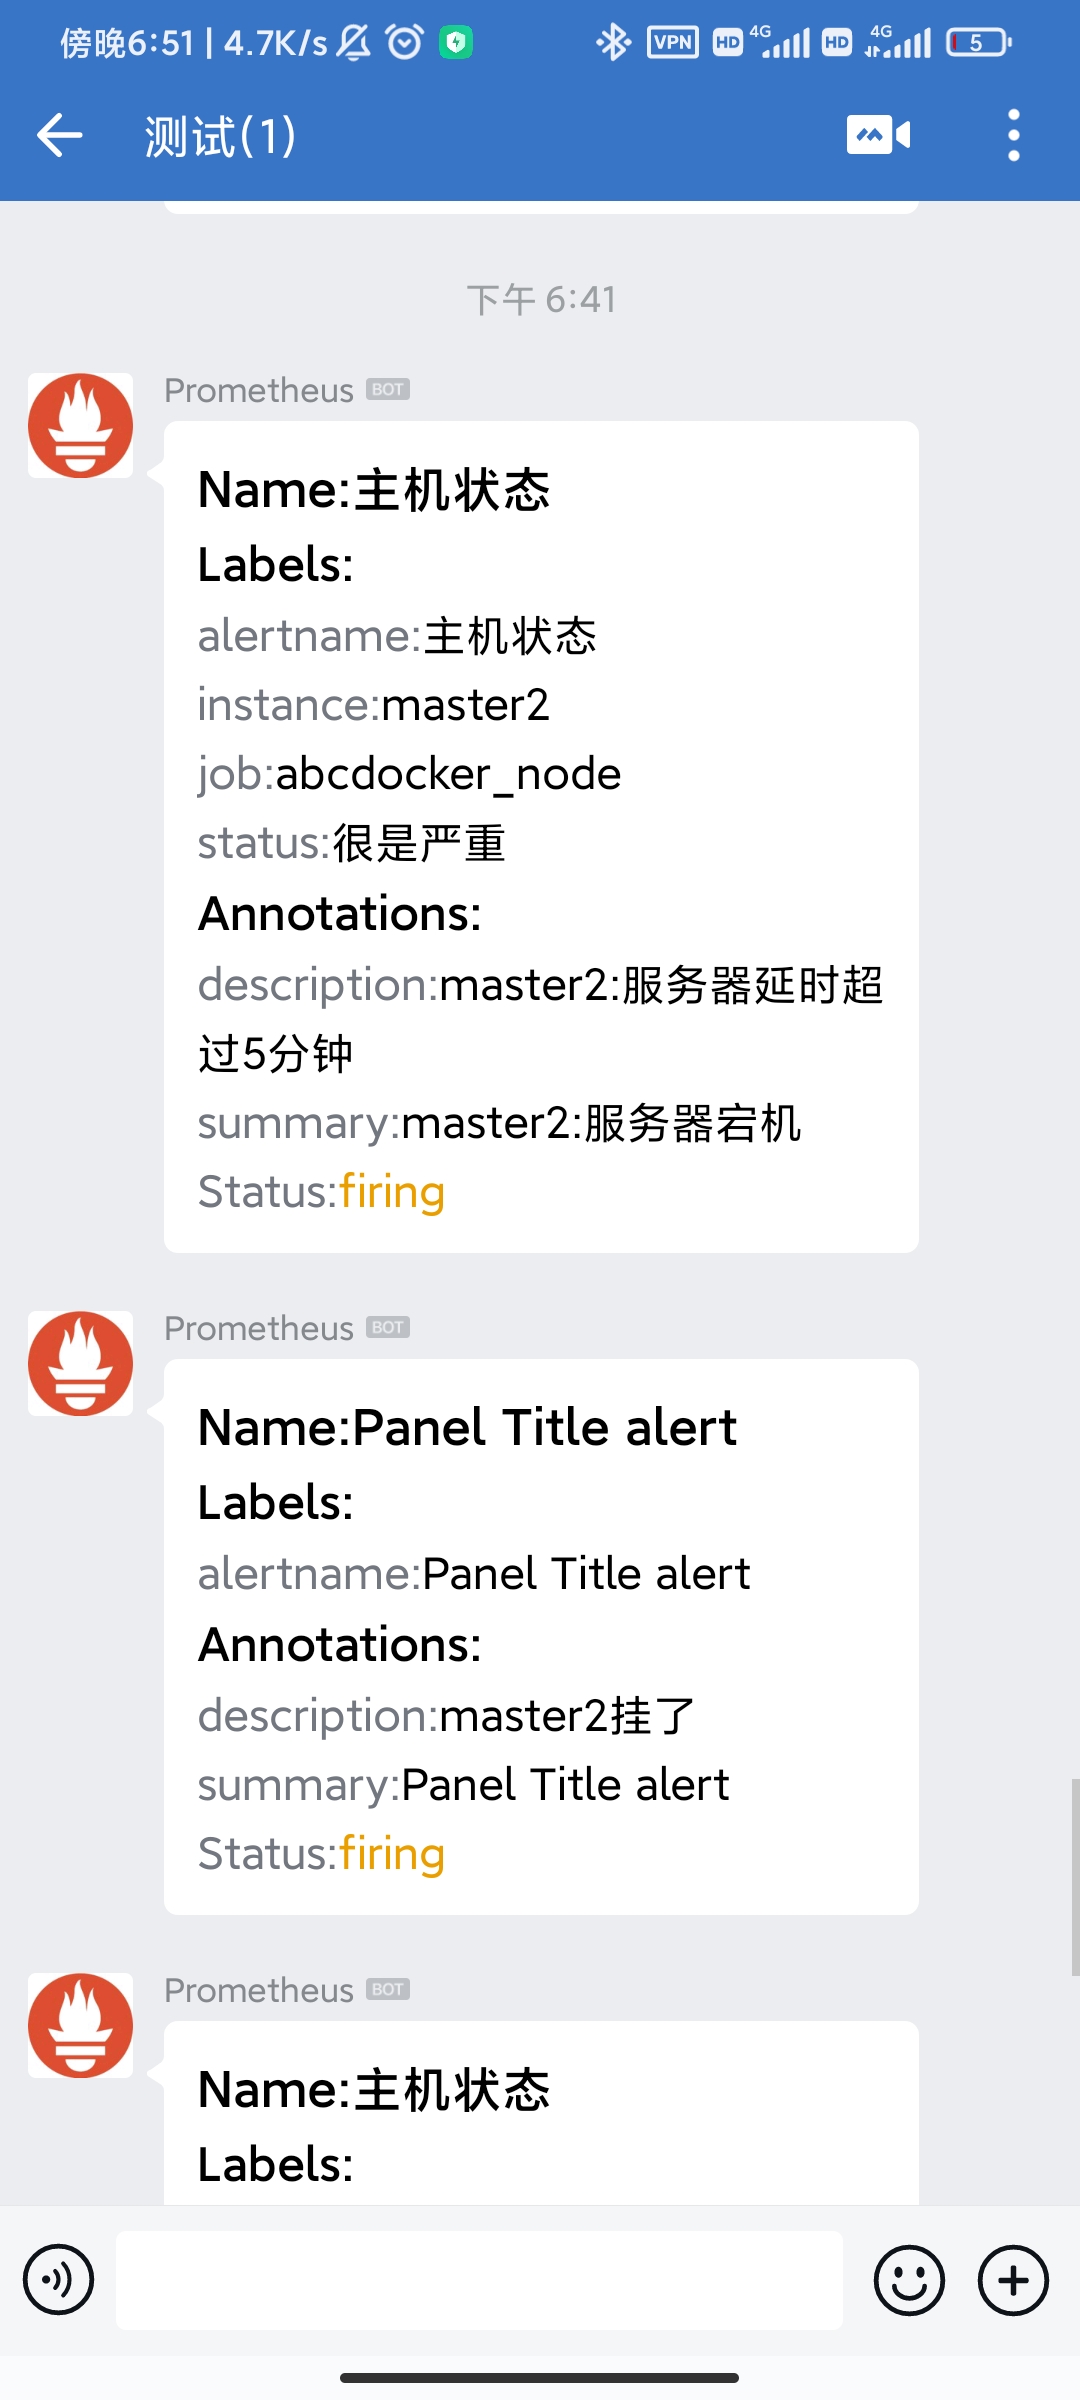
Webhook机器人测试
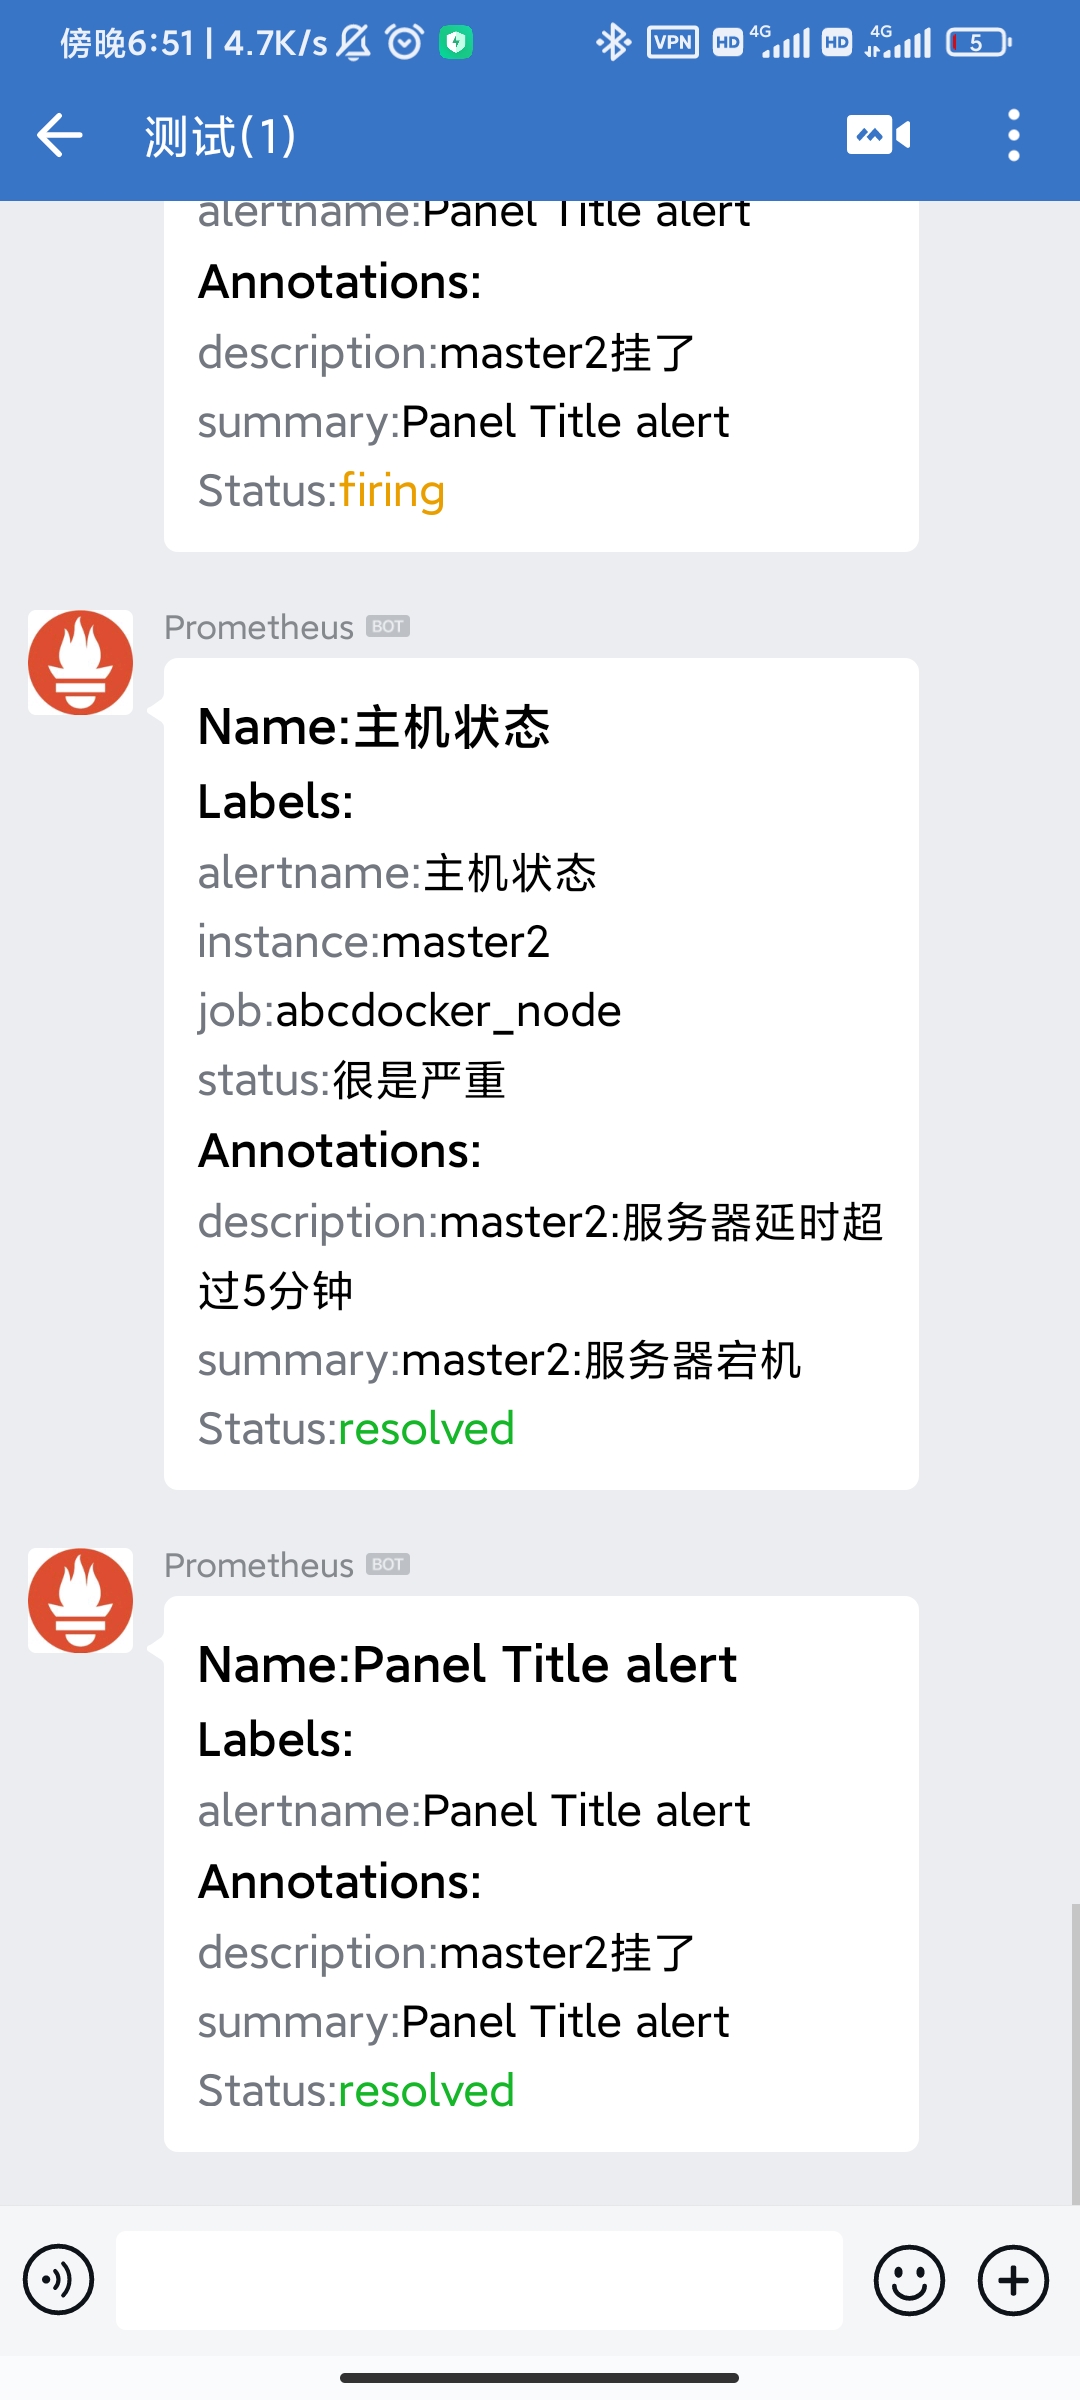
此时推送告警信息,当打开node_exporter功能,推送恢复消息。
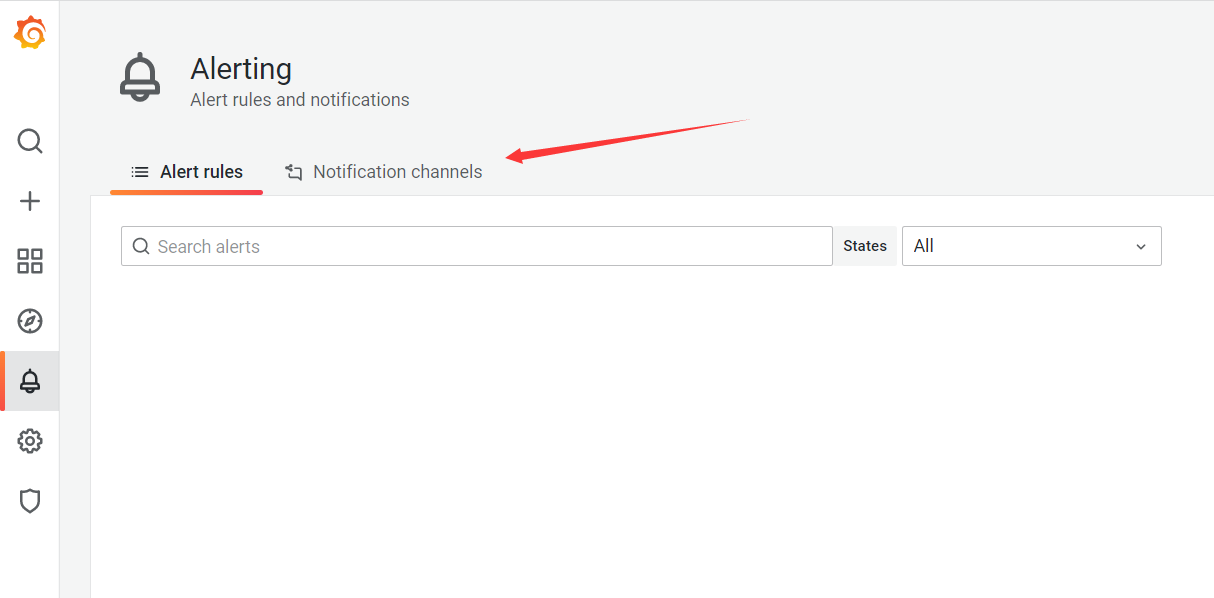
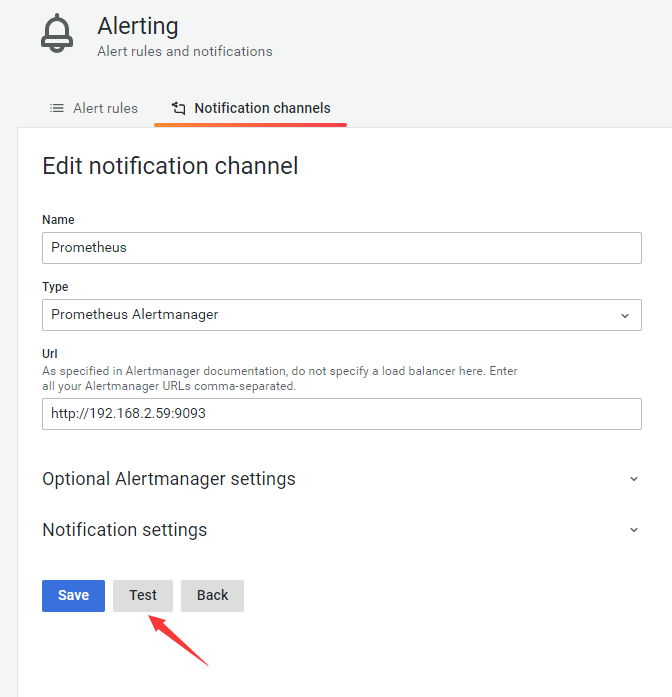
Grafana加入告警
登录grafana的web前端页面
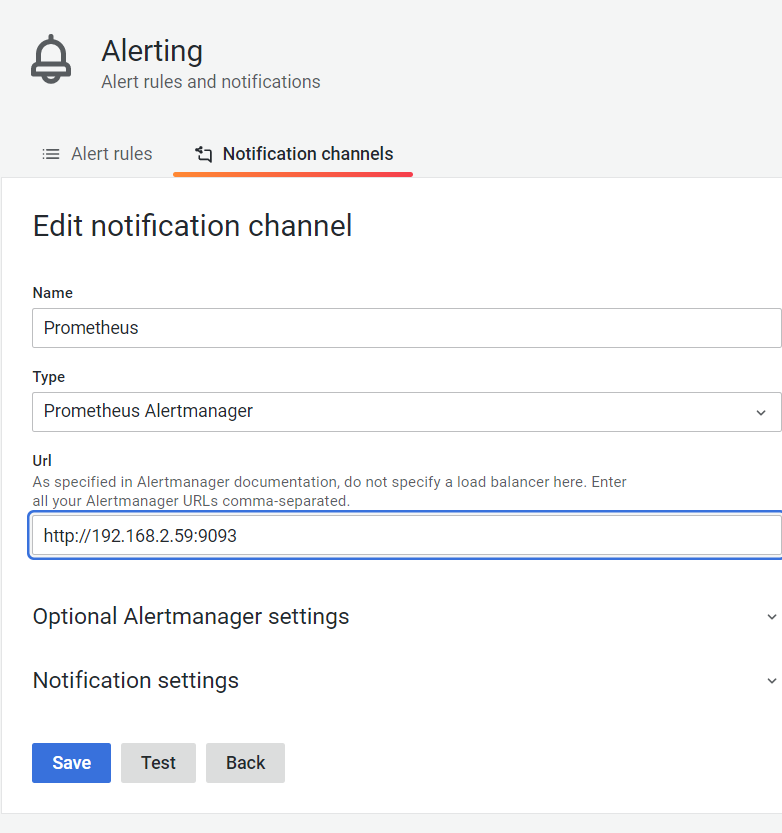
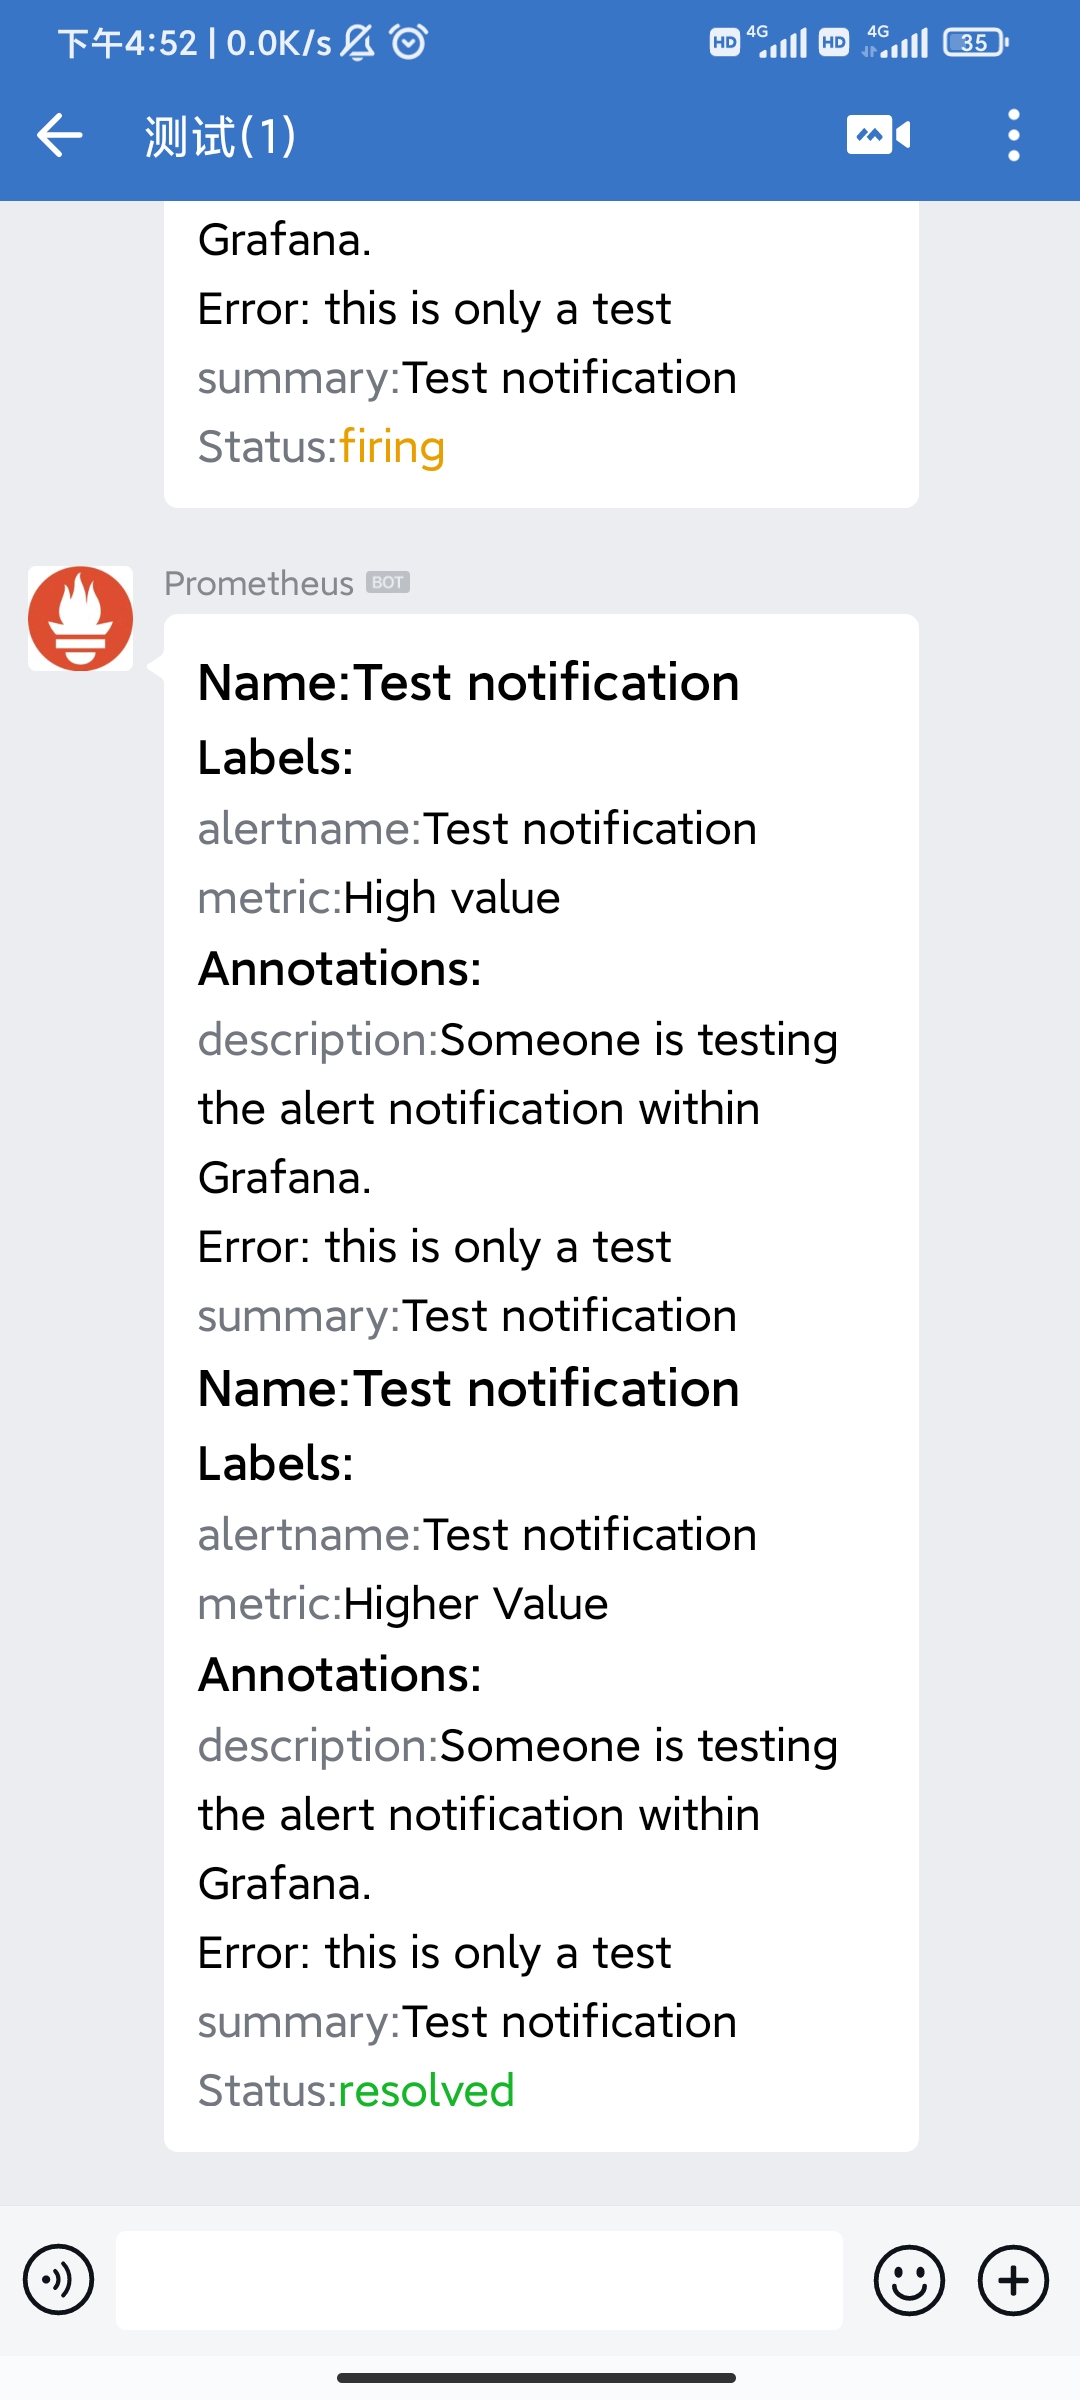
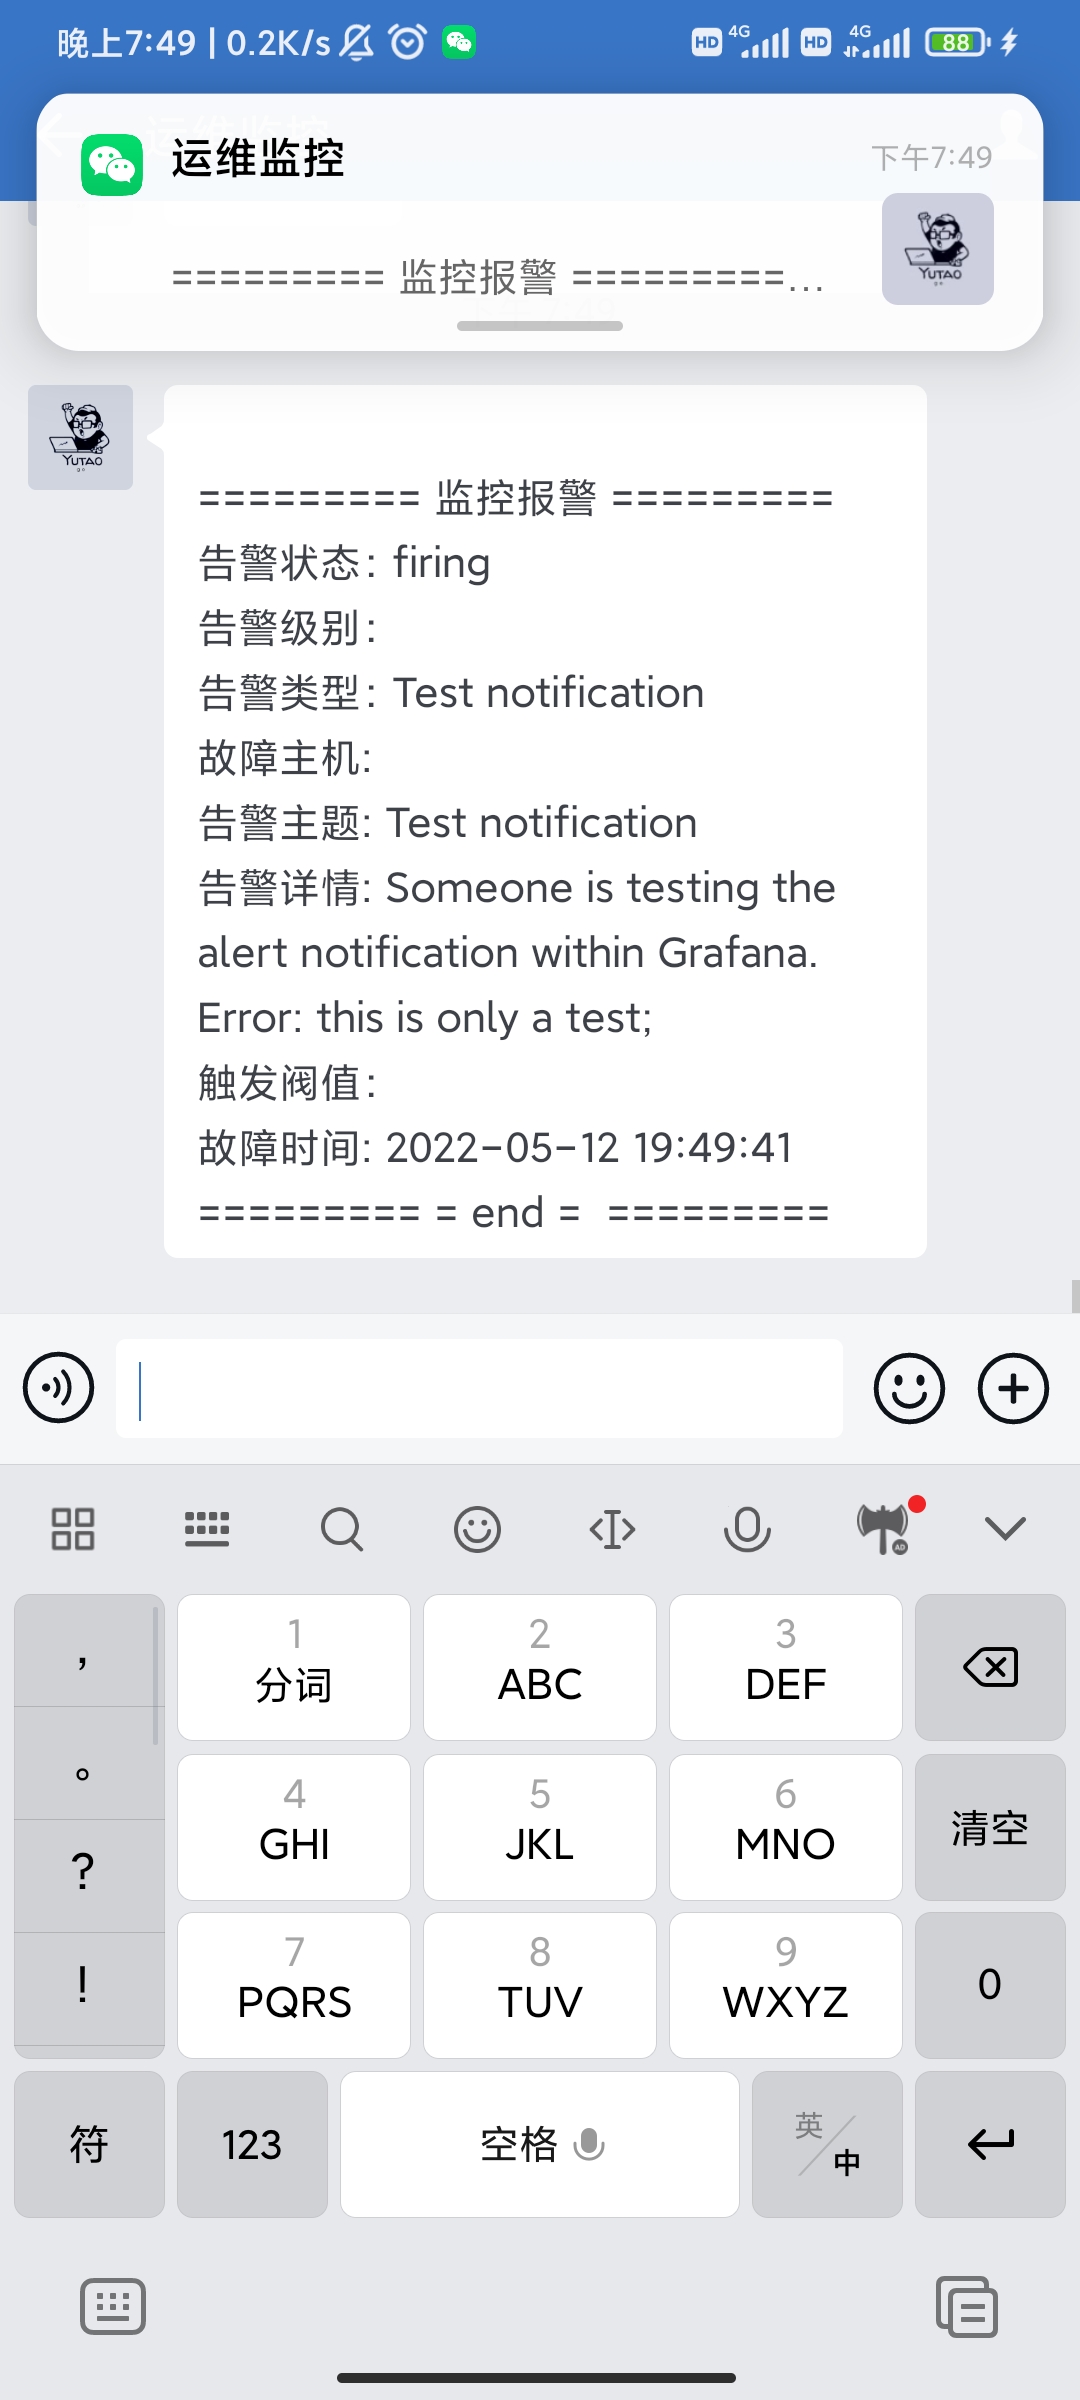
发送一个Test,可以看到推送的测试消息
建立一个node_exporter的面板和告警规则。
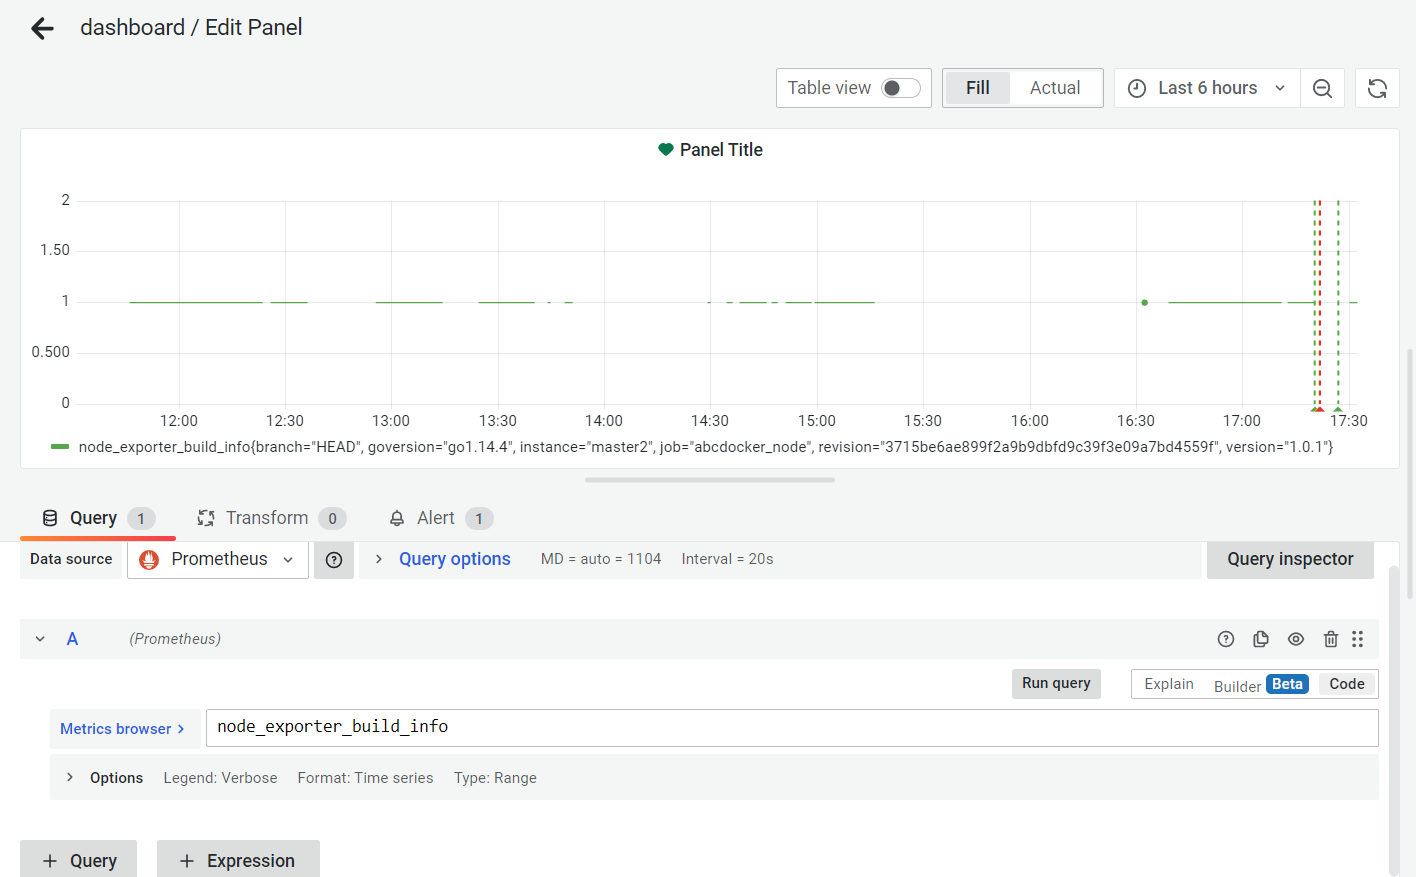
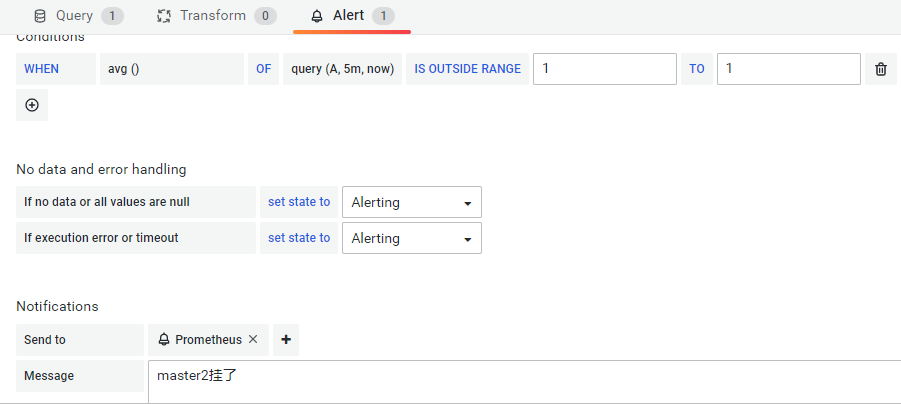
当停掉node_exporter,查看微信推送,打开node_exporter,再查看推送消息
 上面的方式是通过webhook方式告警,钉钉告警类似,下载钉钉的webhook插件,钉钉机器人有安全限制,所以这里没有部署。如果你想要尝试,通过以下命令启动钉钉插件容器
docker run -d \
--name dingtalk \
--restart always \
-p 8060:8060 \
timonwong/prometheus-webhook-dingtalk:master \
--ding.profile="webhook1=https://oapi.dingtalk.com/robot/send?access_token=xxxx(自己的钉钉机器人token)"
通过企业微信应用报警
企业微信应用需要提前部署 注册方法 与webhook机器人不同的是alertmanager.yml的配置文件,这种方式不需要启动插件容器。
修改alertmanager.yml
vim /usr/local/prometheus/alertmanager/alertmanager.yml
global:
  resolve_timeout: 1m   # 每1分钟检测一次是否恢复
  wechat_api_url: 'https://qyapi.weixin.qq.com/cgi-bin/'
  wechat_api_corp_id: 'wwaa6fb***'      # 企业ID
  wechat_api_secret: 'CxydMDA***'     # Secret ID
templates:
  - '/usr/local/alertmanager/template/*.tmpl'  # 使用的模版
route:
  receiver: 'wechat'
  group_by: ['env','instance','type','group','job','alertname']
  group_wait: 10s       # 初次发送告警延时
  group_interval: 10s   # 距离第一次发送告警,等待时间
  repeat_interval: 1h   # 告警重发时间
receivers:
- name: 'wechat'
  wechat_configs:
  - send_resolved: true
    message: ''
    to_party: '1'          # 接收告警的部门ID
    agent_id: '1000002'    # 接收告警的应用ID
    api_secret: 'CxydMDA***'    # Secret ID
创建模版
mkdir -p /usr/local/alertmanager/template/ && cd /usr/local/alertmanager/template/
vim wechat.tmpl
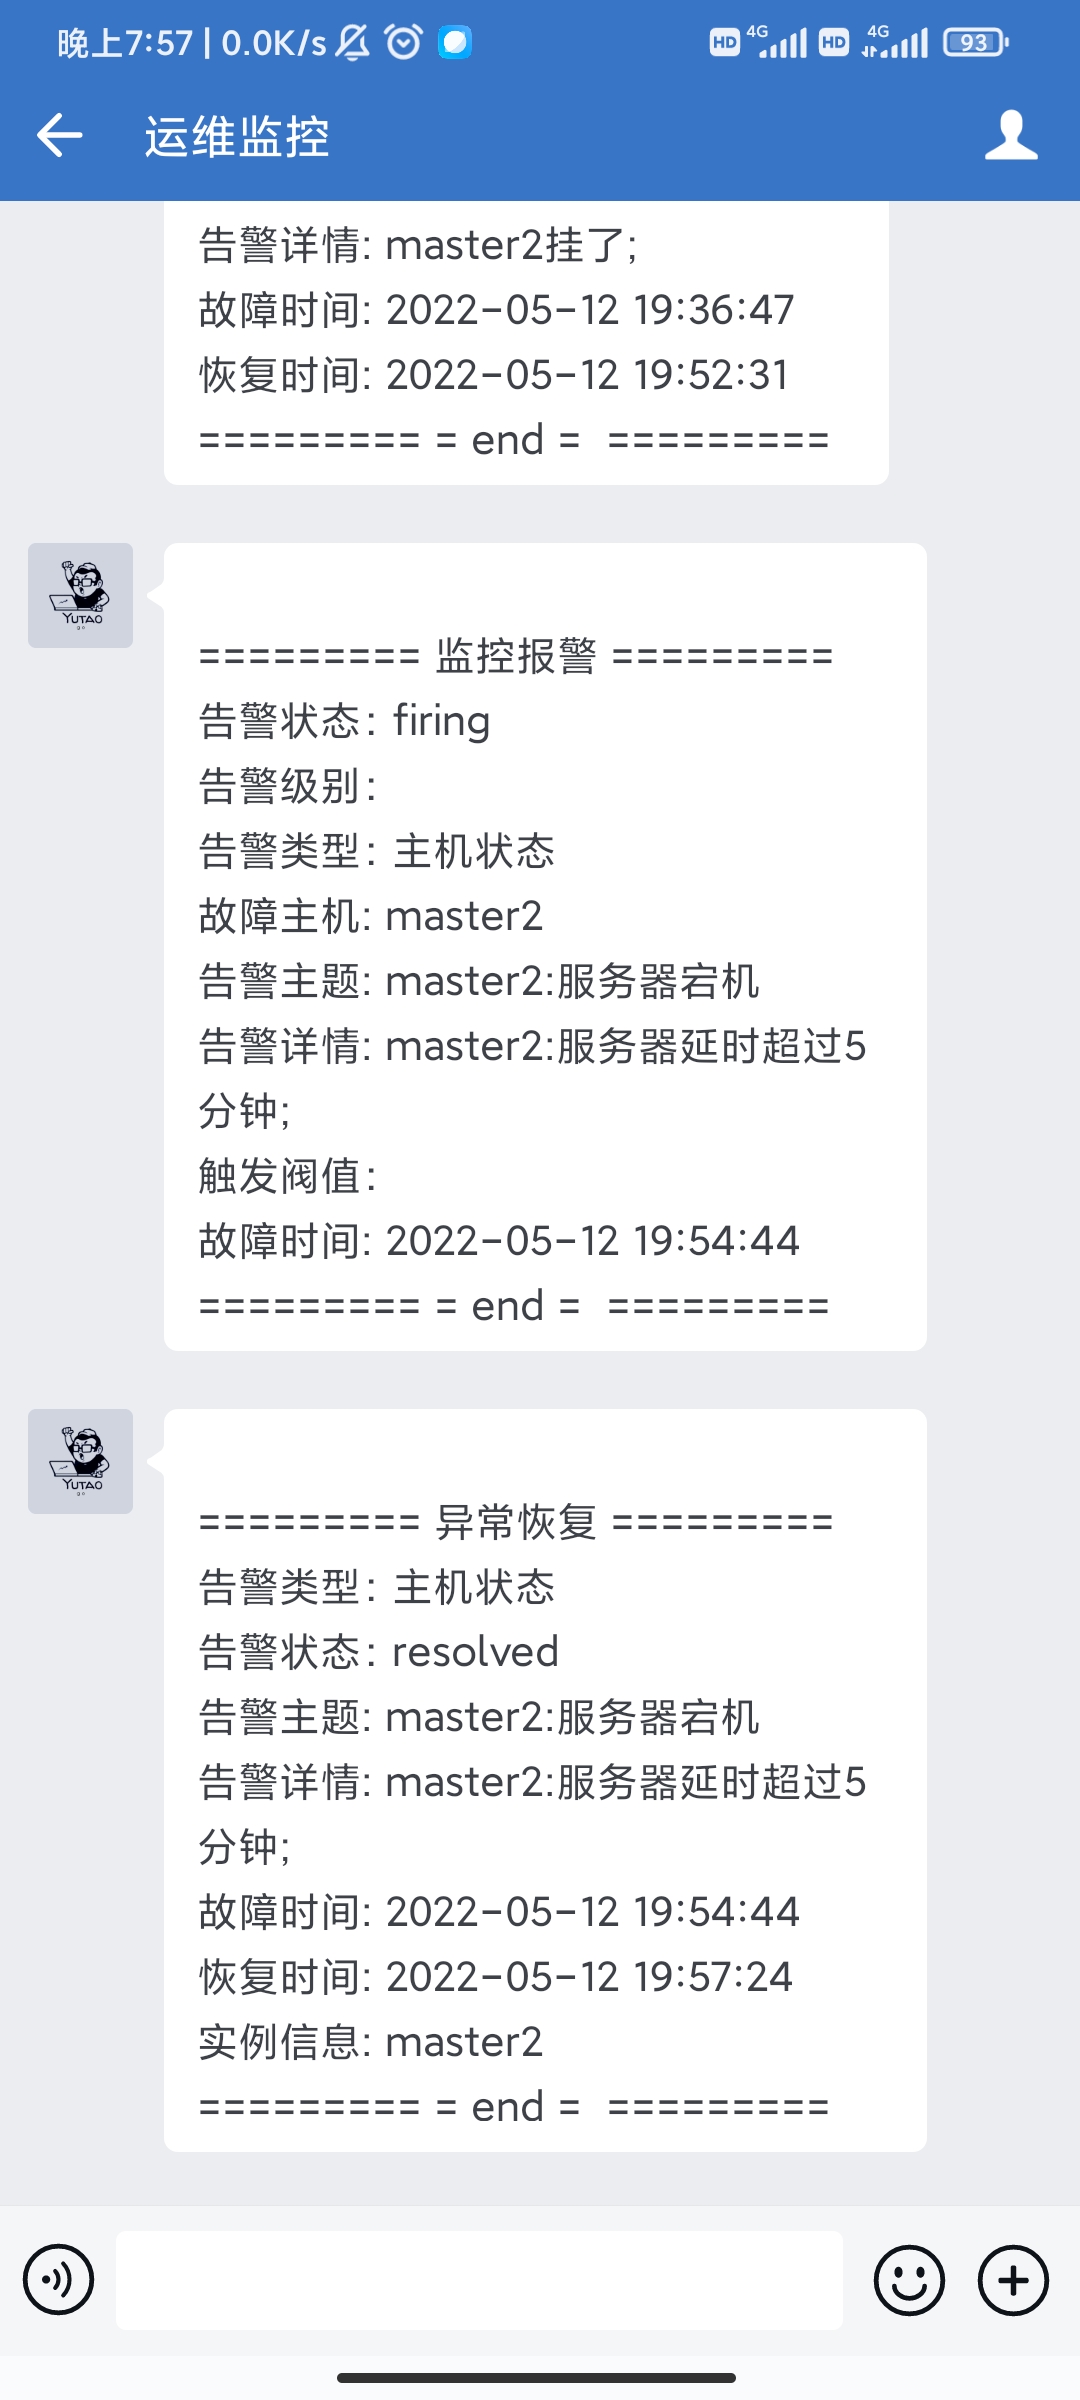
========= 监控报警 =========
告警状态:
告警级别:
告警类型:
故障主机:
告警主题:
告警详情: ;
触发阀值:
故障时间:
========= = end =  =========
========= 异常恢复 =========
告警类型:
告警状态:
告警主题:
告警详情: ;
故障时间:
恢复时间:
实例信息:
========= = end =  =========
systemctl restart alertmanager
企业微信告警测试
如果部署没有问题,会收到测试消息
接下来关停node_exporter服务再打开进行测试